Plot Y from X
 |
 |
| Vector | |
| in the palette | on the schematic |
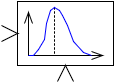
The block implements the plotting of the dependence of the vector Y (second input) on the vector X (first input). The block is designed to display the current simulation results in the form of a plot Y(t,x), which implements the plotting of the curve y(t) = f(x,t) after each integration (calculation) step, where x is a vector containing time-independent constant elements. It can be used both for local simulation and remote debugging to display the values of signals calculated on the target system. This block can be used to display the calculation results in linearly distributed dynamic problems, where, for example, the vector x is the vector of relative spatial coordinates in the simulated object, and the vector-function y(t) describes the non-stationary distribution of some physical value in the simulated object.
Inputs
- X - the vector of values along the abscissa axis.
Outputs
- Y - the vector of values along the ordinate axis
Properties
- Number of plots - a natural number N. If, for example, the number 3 is entered, then the block will have 6 input ports: ports on the left for data input that correspond to the coordinates along the abscissa axis, and ports from below for input of the values of vector functions y(t).
Parameters
- X-values - the vector of all X-values;
- Y-values - the vector of all Y-values.