The block implements the display of the calculation results in a three-dimensional rectangular coordinate system using the following data presentation methods:
Cumulative from three scalars - the values of instantaneous coordinates along the corresponding axes are fed to the inputs of the block, and the body plotting takes place by accumulating the values of the coordinates.
Instantaneous from three vectors - vectors of the same dimension, equal to the number of points forming the body, are received at the X, Y, Z inputs of the block; the i-th point has the coordinates Xi, Yi, Zi.
Instantaneous from 2 vectors and a matrix - the inputs of the block receive coordinate vectors along the corresponding axes, the input Z is supplied with a matrix of dimension m×n (where m, n is the dimension of vectors X and Y), in which the Zij element corresponds to the value of the coordinate Z at the point with the coordinate [Xi; Yj] on the XY plane;
Instantaneous from a matrix - body plotting by the points formed by the matrix [[X1, Y1, Z1];…;[Xn, Yn, Zn]].
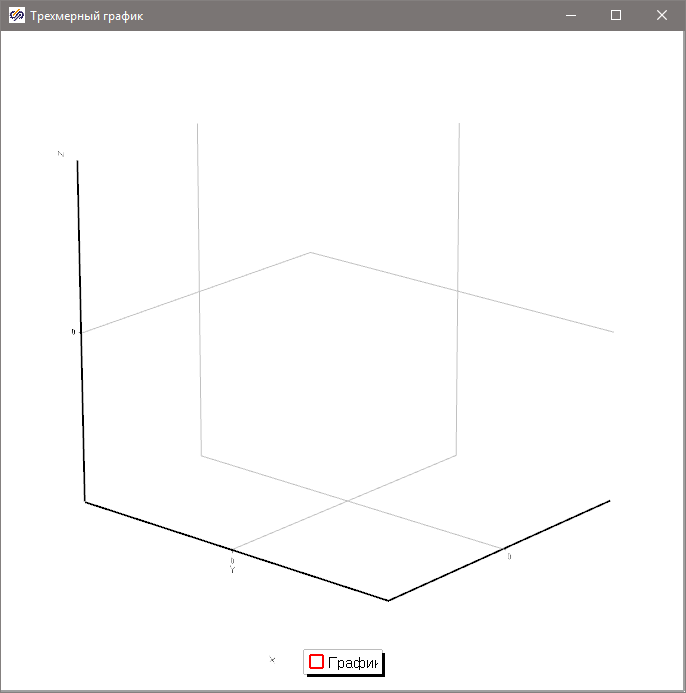
In this case, the unit provides the plotting of both three-dimensional surfaces and three-dimensional trajectories according to the input data. It can be used both for local simulation and remote debugging to display the values of signals calculated on the target system. In the Schematic window (shemnoe_okno_proekta) the block image is similar to the image of any standard block - a rectangle with a characteristic icon. If you click 2 times with the left mouse button on the block image in the schematic window, the so-called graphic window opens (it is also opened when initially placing the block on the schematic):
Figure 1. Three-dimensional plot windowRight-clicking the mouse in the three-dimensional plot window leads to the context menu, which has the Properties item that opens access to the corresponding window:
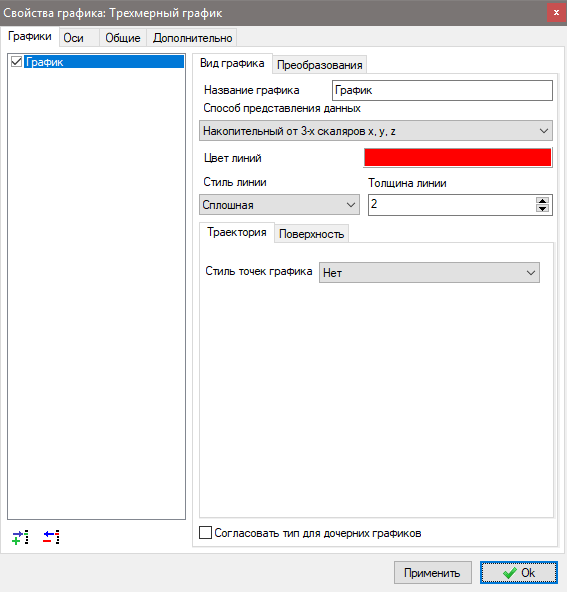
Figure 2. Three-dimensional plot properties windowThe window contains a set of tabs and subtabs that allow the block to configure the reception, processing and display of incoming data:
Plot - contains a list of displayed plots, as well as subtabs for customizing the data presentation:
Plotview - determines the way the data is presented, the color and style of the lines, as well as the formed three-dimensional body:
Trajectory - if this tab is open, then based on the data received, the block will build a three-dimensional trajectory. Here you can also select the style of the trajectory points.
Surface - if this tab is open, then based on the data received, the block will build a three-dimensional surface. Here you can also choose the color scheme of the resulting surface, as well as customize the display of isolines.
Transformations - contains tools for normalizing the values displayed along the axes.
Axes - contains tools for setting ranges and scale scales.
General - header settings, legends, colors and position of the window.
Additional options - plot update time, the maximum number of displayed points and other settings.
Note:
similarly to this block, work is carried out with an object, such as "Three-dimensional graph", created in the Data Manager (meneger_dannyh.dita), except that the input data is not fed to the ports, but added as parameters of the object in the data manager.
Inputs
X is the input data supply port. The format of the data transmitted to the port depends on the selected method of data presentation (scalar - for the first type, vector - for the rest (see list));
Y is the input data supply port. The format of the data transmitted to the port depends on the selected method of data presentation (scalar - for the first type, vector - for the rest (see list));
Z is the input data supply port. The format of the data transmitted to the port depends on the selected method of data representation (scalar - for the first type, vector - for the second and fourth types, matrix - for the second type (see list)).